class: center, middle, inverse, title-slide # Data Visualization ## Grammar of Graphics ### Dr Thiyanga Talagala ### 2020-03-03 --- class: center, middle # Grammar of graphics Mapping data to **aesthetic** attributes (colour, shape, size) of **geometric** objects (points, lines, bars). --- ## Elements of ggplot2 object - Data: data to be plotted - Aes: mapping between variables to their visualization - Geoms: objects/shapes you add as layers to the graph (How the plot will work?) - Stats: statistical transformations when you are not plotting the raw data - Faceting: multiple panels --- ### Layer grammatical elements 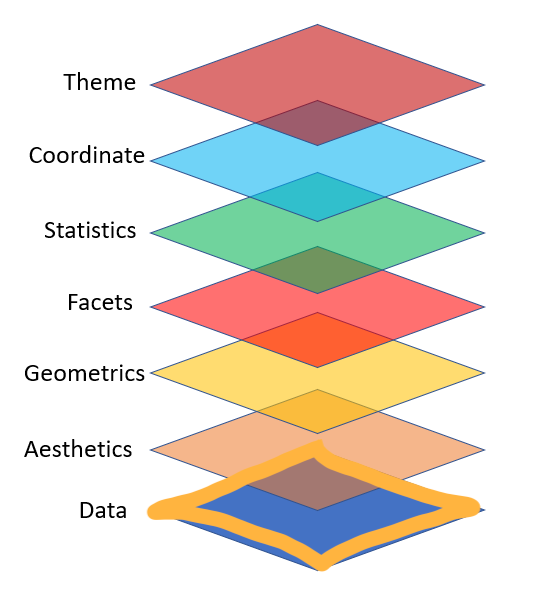 --- ## Making your first plot with ggplot ```r library(ggplot2) ggplot() ``` <!-- --> --- ## Making your first plot with ggplot - Data ```r ggplot(iris) ``` <!-- --> --- ## Making your first plot with ggplot - Data + Aes ```r ggplot(iris, aes(x = Sepal.Length, y = Sepal.Width)) ``` 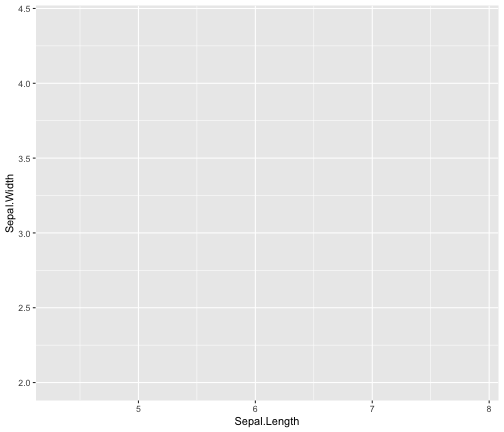<!-- --> --- ## Making your first plot with ggplot - Data + Aes + Geom ```r ggplot(iris, aes(x = Sepal.Length, y = Sepal.Width)) + geom_point() ``` 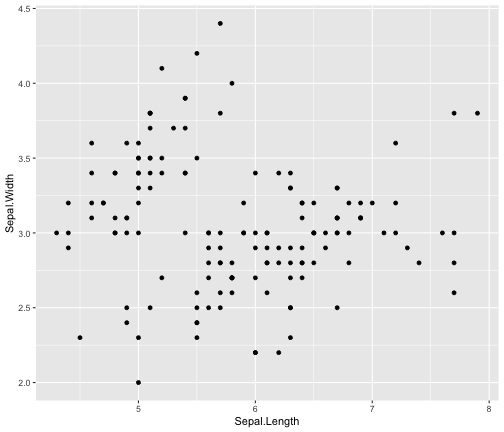<!-- --> --- ## Making your first plot with ggplot - Data + Aes + Geom + Facets ```r ggplot(iris, aes(x = Sepal.Length, y = Sepal.Width)) + geom_point() + facet_grid(. ~ Species) ``` 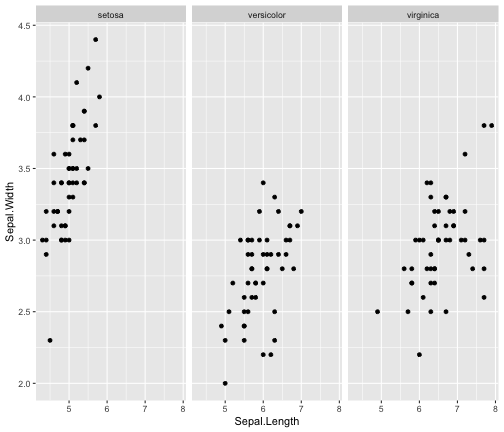<!-- --> --- ## Making your first plot with ggplot - Data + Aes + Geom + Facets + Statistics ```r ggplot(iris, aes(x = Sepal.Length, y = Sepal.Width)) + geom_point() + facet_grid(. ~ Species) + stat_smooth(method = "lm", se=F, col="red") ``` ``` `geom_smooth()` using formula 'y ~ x' ``` <!-- --> --- ## Making your first plot with ggplot - Data + Aes + Geom + Facets + Statistics + Coordinates ```r ggplot(iris, aes(x = Sepal.Length, y = Sepal.Width)) + geom_point() + facet_grid(. ~ Species) + stat_smooth(method = "lm", se=F, col="red") + scale_y_continuous("Sepal Width (cm)")+ scale_x_continuous("Sepal Width (cm)")+ coord_equal() ``` <!-- --> --- ## Making your first plot with ggplot - Data + Aes + Geom + Facets + Statistics + Coordinates + Theme ```r ggplot(iris, aes(x = Sepal.Length, y = Sepal.Width)) + geom_point() + facet_grid(. ~ Species) + stat_smooth(method = "lm", se=F, col="red") + scale_y_continuous("Sepal Width (cm)")+ scale_x_continuous("Sepal Width (cm)")+ coord_equal()+ theme(panel.background = element_blank()) ``` <!-- -->