Early Maps and Diagrams
550 BC: The first world map?, Anaximander of Miletus
1350: Bar graph of theoretical function, N. Oresme, France
c. 1280: Diagrams of paired comparisons for electoral systems- Ramon Llull, Spain
1375: Catalan Atlas, an exquisitely beautiful visual cosmography, perpetual calendar, and thematic representation of the known world, Abraham Cresques, Spain

1600-1699: Measurement and Theory
1626: Visual representations used to chart the changes in sunspots over time, Christopher Scheiner
1644: First visual representation of statistical data, M.F. van Langren, Spain
1669: First graph of a continuous distribution function (Gaunt’s life table), Christiaan Huygens.
1693: First use of areas of rectangles to display probabilities of independent binary events Edmund Halley, England
1700-1799: New graphic forms
1701: Isobar map, lines of equal magnetic declination, Edmund Halley
1765: Historical time line (life spans of famous people), Joseph Priestley
1782: First topographical map, Marcellin du Carla-Boniface
1786: Bar chart, line graphs of economic data, William Playfair
1786: Bar chart and line graph showing three time series: Price of wheat, weekly wages and reigning monarch over a 250+ year span, William Playfair
1800-1849: Beginning of modern data graphics
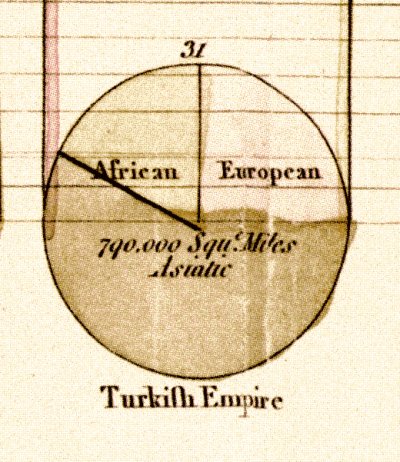
- 1801: Pie chart, circle graph invented, William Playfai

1819: First modern statistical map (illiteracy in France), Charles Dupin
1843: Wind-rose (polar coordinates), L. Lalanne
1844: variable width, divided bars, area ~ cost of transport, C. J. Minard
1850-1899: Golden Age
1855: Dot map of disease data (cholera), John Snow
1858: Diagram of the Causes of Mortality in the Army of the East, Florence Nightingale

1879: Stereogram (3D population pyramid), Luigi Perozzo
1884: Recursive multi-mosaic on a map, Emile Cheysson
1896: Area rectangles on a map to display two variables and their product, Jacques Bertillon